UC:IS:Railway Simulation Laboratory
| Railway Simulation Laboratory (RLAB) Subschema: Infrastructure Reported by: Czech Technical University in Prague (ČVUT) | |||
| |||
| For general information on use cases see UC:Use cases |
Use case / Anwendungsfall
Railway Laboratory (Simulations and Research Support)
Description / Beschreibung
The aim of our project is to simulate railway traffic in laboratory conditions in order to improve and develop various technologies of global optimization (ATO, ATP, timetabling…) for further possible use in practice. Our Railway laboratory has been equipped with model railway lines and stations, including signaling based on various real interlocking systems used in our country. Many functions are ensured by computer simulations as well. The laboratory also serves for educational purposes (to familiarize the students with different railway issues). At present, our project is mainly focused to develop and implementing new technology of intelligent traffic system on railway, mainly realized by ERTMS/ETCS (L1, L2 and L3) and other information systems for dispatcher systems. The whole system is expected to be gradually extended (e.g. intended implementation of a train driving simulator connected with the model railway operation). One of our challenges is to create a complex data model of the model railway infrastructure to become a common base for the related abovementioned applications.
Data Flows and Interfaces / Datenflüsse und Schnittstellen
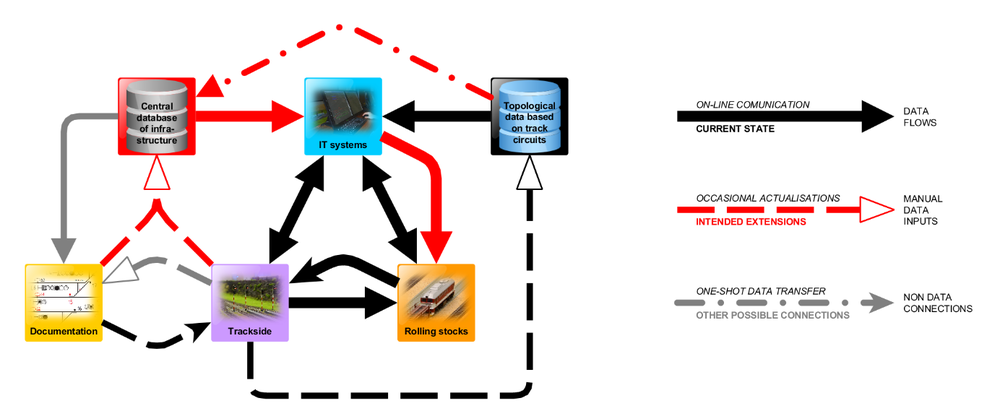
The current data flows – concerning the trackside model infrastructure, rolling stocks and related IT systems – are shown in the schema below (the black solid arrows). The existing topology database is based on the track circuits. In order to enable desired functions, the creation of the data model is essential to become a basis for more detailed data communication – possibly via railML v3 (e.g. providing the detailed infrastructure data to an ATO-driven train – the red arrows). The format could be used for other extensions (e.g. data visualizations – the gray solid arrow) as well.
Interference with other railML® schemas / Interferenz mit anderen railML®-Schemas
Possibly with interlocking, rolling stock and timetable (not yet decided).
Characterizing Data / Charakterisierung der Daten
Probably the biggest issue concerning the data is to manage the scale discrepancy in relation to the real railway (distances, slopes, curves, speed, time…). It should be possible to express the state of the particular elements (both as regards the operating status and the decommissioned assets).
How often do the data change (update)?
- Regular / occasional changes: updating the model (dashed arrows in the schema)
- Realtime (seconds): providing the infrastructure data to the train (e.g. the case of the ATO)
How big are the data fragments to be exchanged (complexity)?
- Whole data set (network): the regular / occasional changes
- Big (station / yard): the track – train communication
Which views are represented by the data (focus)?
Signaling, geometry, energy, statistics…
Which specific data do you expect to receive/send (elements)?
- topology – both the macroscopic and microscopic view
- switches
- signals
- speed profiles and restrictions – different types
- platform edges – incl. stop posts and passenger walkways across the tracks)
- gradient changes
- balises – two different types (physical and virtual) are required
- track circuits
- horizontal curves
- level crossings
- tunnels
- bridges
- electrification changes – incl. signals for electric operation (for later implementation)
- sound horn spots
